Leadership styles

The Situational Leadership Theory is a leadership theory developed by Paul Hersey and Ken Blanchard. The main principle of this theory is that there is not a single way in the leadership style so the most effective way is to adapt the leadership style to the maturity of the staff that is being leading and the details of the task.

Leadership Styles

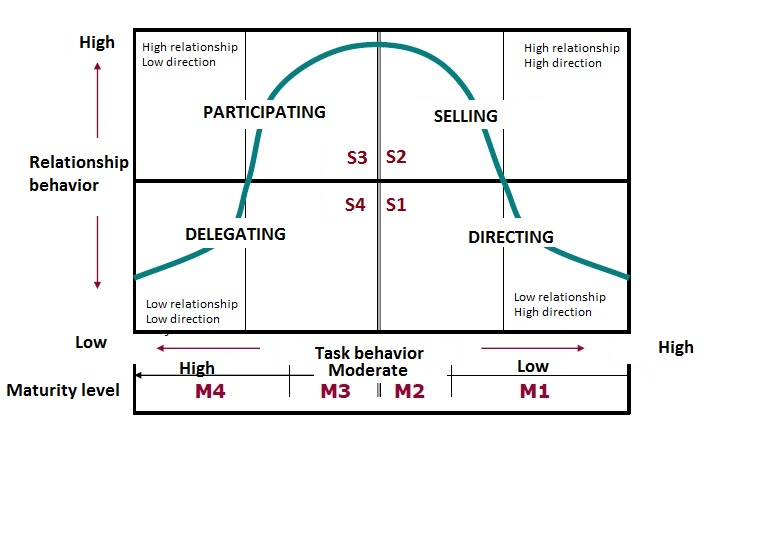
Hersey and Blanchard categorized the leadership styles into four behavior types:

  • Telling (S1): where the leader provides the what, how, when, and where to do the task. This style is based on a high level of direction and a low level of relationship.

(Gene Hackman with a telling leadership style in Crisom Tide)

  • Selling (S2): where the leader provides information and direction, but there’s more communication with the team. Leaders “sell” their message to get people on board. In this style, there are a high level of power by there are a high level of relationship too,

(Josh Lucas is a selling leader in Glory Road)

  • Participating (S3): where the leader works with the team, and shares decision-making responsibilities. In this style, there are less level of direction and is focused on the relationship.

(Robin Williams is a Participating leader in Dead Poets Society)

  • Delegating (S4): where the leader delegates or pass most of the responsibility to the team. The leader still monitors progress, but he’s less involved in decisions. In this style, there are a low level of direction and relationships.

(Al Pacino is a Delegating Leader in Any Given Sunday)

But the leadership style will depends on the level of maturity of the person to be lead. Hersey and Blanchard identified for level of Maturity for their theory.

    • M1: where the team member lack of the specific skills required for the specific tasks or goal in hand and is unable and unwilling to do or to take responsibility for this job or task.
    • M2: where the team member is unable to take on responsibility for the task being done but, they are willing to work at the task.
    • M3: where the team member is experienced and able to do the task but with a lack of confidence or willingness to take on responsibility.
    • M4: where the team member is experienced at the task with their own ability to accomplish it. And he´s able and willing to take responsibility for the task.

Based on this theory, no one style is considered optimal for all leaders to use all the time. And the leadership style for one team member could be evolving at the same time the collaborator’s skills are improving. The recommended leadership styles associated with maturity levels are shown in the Situational leadership curve.

SituationalLeadershipCurve

Building KPI´s

If you have to achieve goals in your company you have to measure the performance or success in your activities. A KPI (Key Performance Indicator) report is a great way to do it.

A KPI is a measurable value that shows if a company is performing well and achieving the goals or business objectives or if a process or service is working well.

-Number of bookings in an online store page during the holiday season (Business objective)

-Number of issues solved in a Software Maintenance Service (Service Performance)

-Number of calls issues solved in a call center (Service Performance)

During the process of defining and creating the KPI´s we have to avoid :

-Measures are not relevant

-The data are not accurate and we have changes between similar periods

-The measures are not aligned with the company strategy goals

-The final report with the measurement are not easy to understand

-The first measurement of this could be use to establish a baseline in order to compare an improve in the future periods.

Measuring a Service Performance with KPI´s

Let see, we have a Service that provides support to all employees in a company that sells air conditioning equipment that are using an specific CRM software. The Service consist in a Call Center and a dedicated team that solves issues and create new features for software based on the business needs.

We want to have an accurate view about the performance of this service about the software performance and how the team is dedicating his time.

So what we need to measure?

With a clear goals we have to ask the right questions, and every question will lead us to a KPI measure.

BlogKPIS1

Get accurate measures: We need a tool to track the activity of the process. It could be a ticketing tool a database, something where we can get clear registers of the activity that we want to measure.

Are these measures meaningful?: We should avoid overmeasure or get measures that has not sense.

When we get the measures we have to prepare dashboard with the monthly results. In this dashboard we should include

  • YoY measures in order to have an overview
  • Clear data about the last two months
  • Some comments about why we get this data.

Below some examples how we show the KPI´s with and overview of the last 12 months and data about the average and the last two months

Response and resolution time: this KPI shows a trend that the issue grew during mid summer because this company has more activity (they sell air conditioning equipments), but along the time the response time is going down

BlogKPI2

Capacity vs demand: this KPI show if the team is overloaded during the last 12 months. But we have the capacity and the demand aligned

BlogKPI4

% Demand vs time logged in issues: this KPI shows that the team efficiency solving issues


The quality cost

What is quality in a project? If we have a project that requires manufacturing 10000 cardboard boxes for a luxury fashion house. How can we measure the quality of this project? Someone will tell us that the boxes should be resistant, others will request that the boxes should be provided with a cool design, and others that the boxes must could carrier more than 5 kilograms. But if our client only needs a simple cardboard box to store apparel and the boxes will not be used for shipping why are we requesting these extra features?

The PMBOK defines the quality project as the degree to which the project fulfills requirements. In this case, a simple cardboard box with the requested measures will provide enough quality to the project.

The meet the expected quality the Project needs a quality control or test phase to ensure that there are no errors in the final product.

How we can test the final product? It depends on the product. In our boxes project, we have to ensure that the boxes have the expected measures. But have we to measure 10000 cardboard boxes?

When we prepare a quality control or quality assurance process we have to apply a cost-benefit rule. So the cost of quality test should be lower than the cost of reprocessing or non-conformance. Maybe in our project measure 10000 boxes could be more expensive than re-manufacture 100 boxes.

QualityCost

To avoid extra costs in the quality there are statistical techniques that allow test a sample of boxes and ensure a certain level of quality.

Example:

If the cost of measuring one box is one dollar, and we have a statistical method that ensures that if we take a sample of 2000 units the confidence level is 5%. This means that 95% of boxes should have the correct measures. So if we measure 2000 units we can ensure that we only have 500 boxes with incorrect measurements that we will reprocess.

On other hand we can measure 10000 units to ensure that we have 0 incorrect boxes

As we can see above the quality test with a sample and using statistical methods have a better cost benefits ratio.

QualityCost2

The Eurotunnel and project fail.

The Channel Tunnel is an undersea rail tunnel that links Folkestone in UK and Pas de Calais near Calais in France. The tunnel carries high-speed Eurostar trains. In 2012 the Eurotunnel transported more the 18 million passengers and the freight transported was more than 20 million tonnes.

 eurotunnel31ferry

The tunnel construction began in 1988 with an estimated budget of 2600 million pounds and estimated time of 5 years.

Finally, the construction ended in 1994 with a cost of 4600 million pounds. The project took 20% (6 years over 5 years) longer than planned with an over budget of 80% (4600 M vs 2.6 M).

We call scope creep in project management the phenomenon of uncontrolled changes or continuous growth in the project´s scope. This phenomenon is caused when the scope is not clearly defined.

Why did this project fall into the delays and changes?

Some mistakes that led the Eurotunnel project in this fail were:

Absence of historical records with similar projects.

  • In the Eurotunnel project, the absence of similar precedents in the construction avoided providing the project with historical records. This absence of historical records led to some requirement gaps. To improve safety there was a need for an air conditioning system that was not included in the initial design.

Risk management: we need to identify all the potential risks in the project and define response plans to these risks.

  • At the beginning of the drilling tasks in the Eurotunnel, the drill team found an unexpected hardness of the underground that let delays in the tunneling. Even though there were some underground extraction and analysis before starting the construction, there was and expected risk without a response plan.

Communications plans:  Who send the reporting about the project?  Who needs to receive information? What information must be sent? And how must be sent?

  • In the Eurotunnel project, the communication between the British and French teams who were essentially tunneling from the two different sides and meeting in the middle could have been improved.

Procurement management: It´s necessary a procurement management plan to plan, execute, and control the procurements in the project.

  • Procurement problems: In the Eurotunnel project there were many vendors bidding for the contract. This background led to the ‘winner’s curse’ of the successful bidders having the lowest and most optimistic price estimates, against the most realistic estimates. Finally, the bidder winner could not accomplish the forecast of time and cost.

What´s next?: Maybe an Agile interactive approach should be better.