
If you have to achieve goals in your company you have to measure the performance or success in your activities. A KPI (Key Performance Indicator) report is a great way to do it.
A KPI is a measurable value that shows if a company is performing well and achieving the goals or business objectives or if a process or service is working well.
-Number of bookings in an online store page during the holiday season (Business objective)
-Number of issues solved in a Software Maintenance Service (Service Performance)
-Number of calls issues solved in a call center (Service Performance)
During the process of defining and creating the KPI´s we have to avoid :
-Measures are not relevant
-The data are not accurate and we have changes between similar periods
-The measures are not aligned with the company strategy goals
-The final report with the measurement are not easy to understand
-The first measurement of this could be use to establish a baseline in order to compare an improve in the future periods.
Measuring a Service Performance with KPI´s
Let see, we have a Service that provides support to all employees in a company that sells air conditioning equipment that are using an specific CRM software. The Service consist in a Call Center and a dedicated team that solves issues and create new features for software based on the business needs.
We want to have an accurate view about the performance of this service about the software performance and how the team is dedicating his time.
So what we need to measure?
With a clear goals we have to ask the right questions, and every question will lead us to a KPI measure.
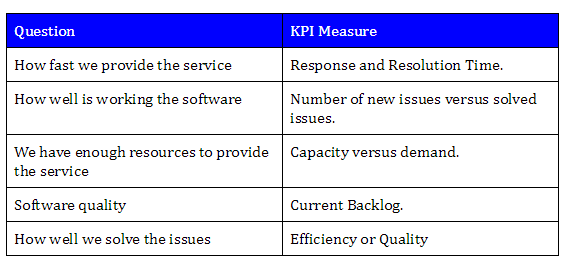
Get accurate measures: We need a tool to track the activity of the process. It could be a ticketing tool a database, something where we can get clear registers of the activity that we want to measure.
Are these measures meaningful?: We should avoid overmeasure or get measures that has not sense.
When we get the measures we have to prepare dashboard with the monthly results. In this dashboard we should include
- YoY measures in order to have an overview
- Clear data about the last two months
- Some comments about why we get this data.
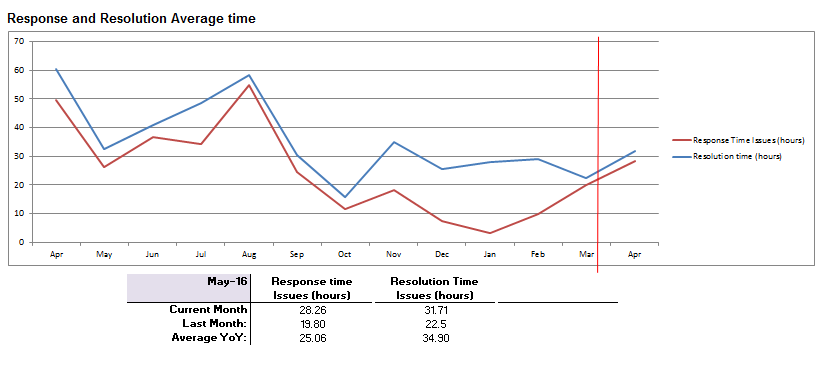
Below some examples how we show the KPI´s with and overview of the last 12 months and data about the average and the last two months
Response and resolution time: this KPI shows a trend that the issue grew during mid summer because this company has more activity (they sell air conditioning equipments), but along the time the response time is going down
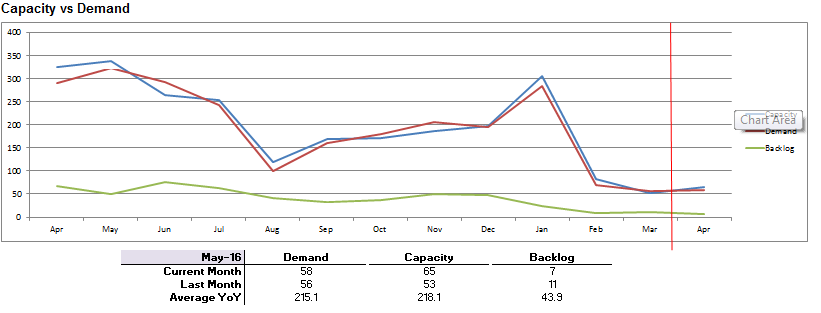
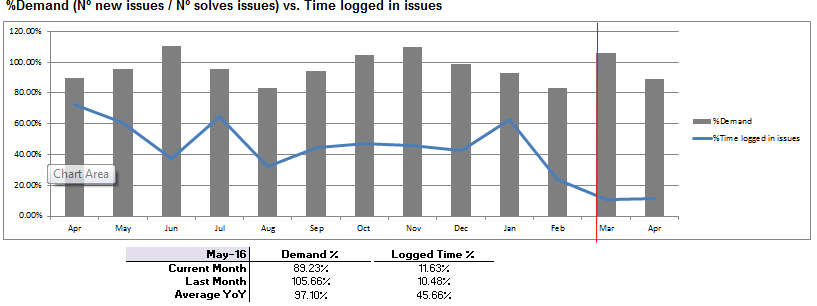
Capacity vs demand: this KPI show if the team is overloaded during the last 12 months. But we have the capacity and the demand aligned